By Conrad Zurini, Broker of Record / Owner
Times really have changed. Does anyone remember any other time when we all knew when the Bank of Canada and/or the US Federal Reserve met. Who cared?!?! Do you remember any other time when people would comment on inflation numbers or wait with baited breath when the new monthly inflation or Consumer Price Index (CPI) numbers were coming out?
When did we become such financial nerds? Whatever happened to getting a job, getting married, and simply buying a house or renting an apartment? What ever happened to deciding to start a family and simply going out and buying a larger home so that “Junior” can have a backyard to play in? Then as your family unit grew, what ever happened to simply buying an even larger home? You used the equity in your current home, which came from paying your home down and some annual appreciation. Until now, I don’t believe that anyone ever paid attention to interest rates or inflation, they just went to their financial institution, got pre-approved, and did what they needed to do.
They weren’t focused on timing the bottom of the market or waiting for interest rates to drop or for inflation to be at 2%. They weren’t watching unemployment rise. And we liked it like that!!!! Mr. Richard Tiffany Macklem, otherwise known as “Tiff”, is the Governor of the Bank of Canada (I guess he didn’t want to be known as “Dick” Macklem, which is good foresight on his part considering he raises rates month after month after month). Anyways, I digress. Recently Tiff, speaking at a press conference after annual meetings of the International Monetary Fund and the World Bank, said that “the Canadian economy is still overheating, with demand out-stripping supply, and the labour market needs to weaken to restore price stability.” The labour market needs to weaken!?!? Huh?
So the powers that be want to cut off the economy at the knees. The last time I remember inflation being tied to interest rates I was in an economic history class taught by none other than the infamous Peter George, former three-term (fifteen-year) President of McMaster University. So stop calling it raising interest rates to cool inflation and label it what it is: wage and price controls. Aren’t governments supposed to be about increasing jobs? What am I missing? Someone should tell Tiff about the great resignation that occurred after the pandemic, that supply chains were cut off, and that Canadian consumers have to make unprecedented savings to buy consumer goods. Maybe someone should whisper in Tiff’s ear to read “Boom, Bust and Echo” so that he can discover that one of the largest segments of our population is Baby Boomers. What’s the average age of a Baby Boomer? It’s 56 to 75: the sweet spot of retirement. According to 2021 census data, 24.9% of the Canadian population is made up of Baby Boomers. That means that a significant amount of people will be leaving the labour market and need to be replaced. So how is Tiff’s theory of raising rates going to stop employment growth when there is a mass exodus of workers? As interest rates rise, retirees will take advantage of higher bank account interest rates. How are we going to replenish these workers and reduce employment rates at the same time?
Back during WWII, many countries, including Canada, instituted price controls and rationing to prevent price gouging and price increases due to wartime shortages. Shortages?! Sound familiar? These measures were largely abandoned soon after the war as they proved ineffective against the overwhelming demand for goods and services. Sound familiar?
From 1975-1978 inflation was at an all-time high. In 1975, it had reached 10.9% and showed no sign of letting up. Trudeau Senior was at the helm and, as a result of such high inflation, introduced the Anti-Inflation Act into Parliament. The Act contained tighter monetary policies, restricted wage increases, and limited government expenditures. By 1978, the effects of wage and price controls were deemed a failure and many of the results of the program negatively impacted the economy. Sound familiar?
Does History Repeat Itself?
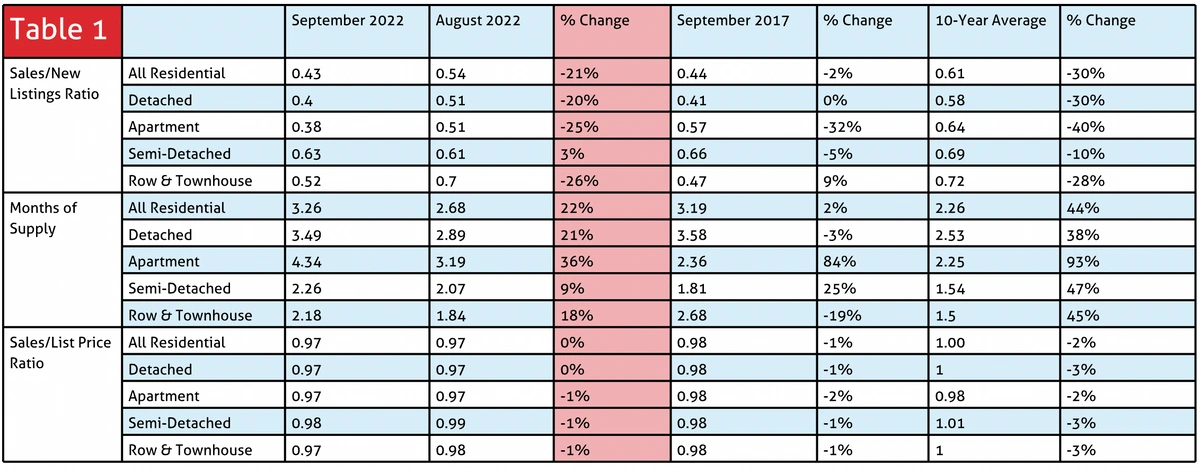
Of course history repeats itself. It may not be the exact same circumstances, but it creates the same results. Case in point: post-WWII versus post COVID-19. Supply has become an issue and inflation kicks in. In Q1 and Q2 of 2017 there was a surge in demand for housing. Sound familiar? That demand caused house sellers to list their homes in droves, supply increased, demand waned in the latter half of the year, and months of supply for all detached homes hit nearly four months (Sept 2022 - 3.26 months, Aug 2022 - 2.68 months, Sept 2017 - 3.19 months and the ten-year average - 2.26 months).
Table 1 represents Hamilton, Burlington, and surrounding areas. It showcases three criteria, on four types of homes, for Sept/Aug 2022, Sept 2017, and the ten-year average. The sales to new listings ratio is a percentage number which measures the temperature of the market, 40% to 60%, is described as a balanced market, under 40% is considered to be a buyer’s market, and over 60% is considered a seller’s market (Sept 2022 - 43%, Aug 2022 - 54%, Sept. 2017 - 44%, and the ten-year average - 61%).
As far as the sales/list price ratio goes, it is a measurement of how close sales prices are to the list price. Look at the similarities between Sept 2017 and Aug/Sept 2022. The market in both cases had begun to stabilize, illustrating the market is showing signs of predictability when it comes to pricing and market value (Sept 2022 - 97%, Aug 2022 - 97%, Sept 2017 - 98%, and the ten-year average - 100%).
See Table 1
Why I Hate Average Price
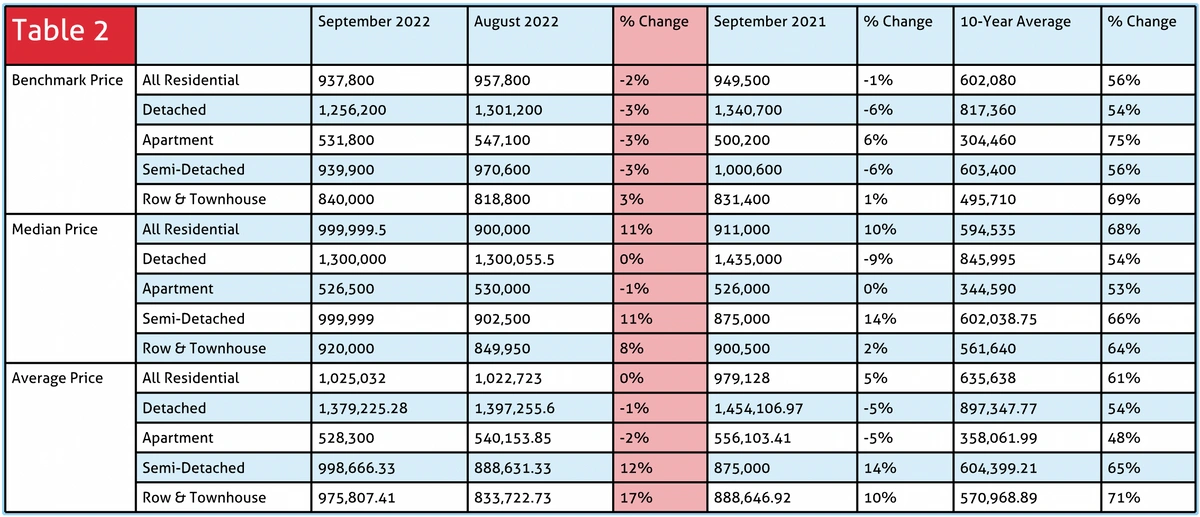
A table is worth a thousand words. Table 2 is the percentage change between Aug 2022 and Sept 2022 in North East Burlington (District 35). The fluctuation is staggering: did townhouses go up 17% in one month? Even the median price, which in the absence of something better, like Benchmark Price, would be my go-to, is also erratic, showing that all residential prices went up 11% in one month. When guiding your clients please explain the pitfalls of average price. Your go-to should be Benchmark Price whenever this tool is available.
See Table 2
Provide The Consumer With a Clear and Accurate Snapshot of the Market
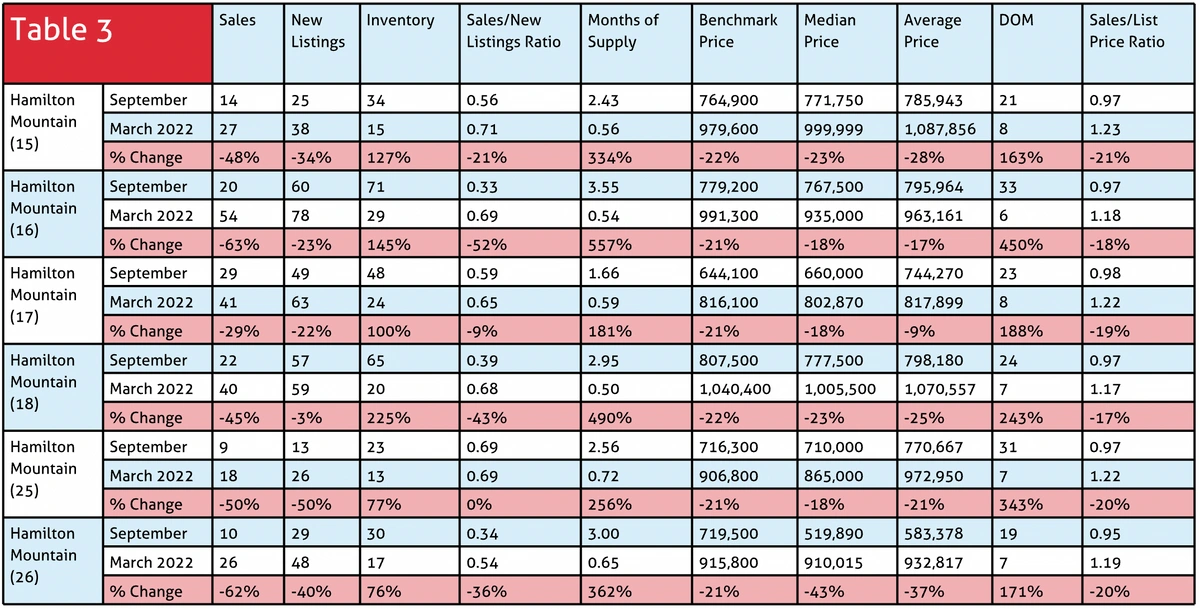
If I was looking to buy a home on the Hamilton Mountain, all I would need to make the best possible economic decision is the following chart and a great REALTOR® to help interpret it. Every vital sign of the market is in the graph below and the data is available for every district (the number in brackets), so new outing districts/areas can be compared easily. Being equipped with this high level of information will help a REALTOR® answer those burning questions that many consumers have.
Q: Where is the most stable investment on Hamilton Mountain?
A: Hamilton Mountain District 25 has shown the most consistency from a sales/new listings perspective. In the height of the market that ratio was 69% (March 2022) and, currently, the ratio sits at 69%. This area, no matter the market conditions, still remains sought after and is probably undervalued due to its consistency of being in a seller’s market.
Q: Where on Hamilton Mountain can I negotiate the best possible price?
District 16 has the highest months of supply, up 557% from the peak of the market, with days on market up 450%.
Q: What area of Hamilton Mountain will I have the most growth potential?
District 26 had the largest decrease in average price from the height of the market (-37%) and one of the highest sales/list ratios of 1.19%, showing desirability in early 2022. It currently sits deep in Buyermarket territory at 34% of sales/new listings ratio.
See Table 3
So Where Do We Go From Here?
The answer to this question should be the same no matter what market we are in. Let’s remind ourselves why we buy and sell homes: to live in!!!! Our lives take twists and turns. It is daunting to overlay life’s circumstances with all the other extenuating data. Work with a professional team (REALTOR®, mortgage specialist, home inspector, lawyer, etc.) and lean into your REALTOR® for data like in the tables prior. There are opportunities in all markets and there are different strategies to success. A great market smoothes the edges of any home purchase and makes us all look like real estate gurus. On the other hand, a transitional market allows the buyer/seller, through the lens of a team of experts, to have control, to smooth out the edges, and make a very smart purchase no matter the circumstances.
Growing up in the family business founded by his parents in 1980, Conrad Zurini has developed a real passion for Real Estate and a commitment to improving the overall client experience. With over 20 years of experience in both Selling and Managing, he has had many achievements in both sales performance and industry development. He was recently received the Burlington Chamber of Commerce 2022 Distinguished Entrepreneur of the Year award.