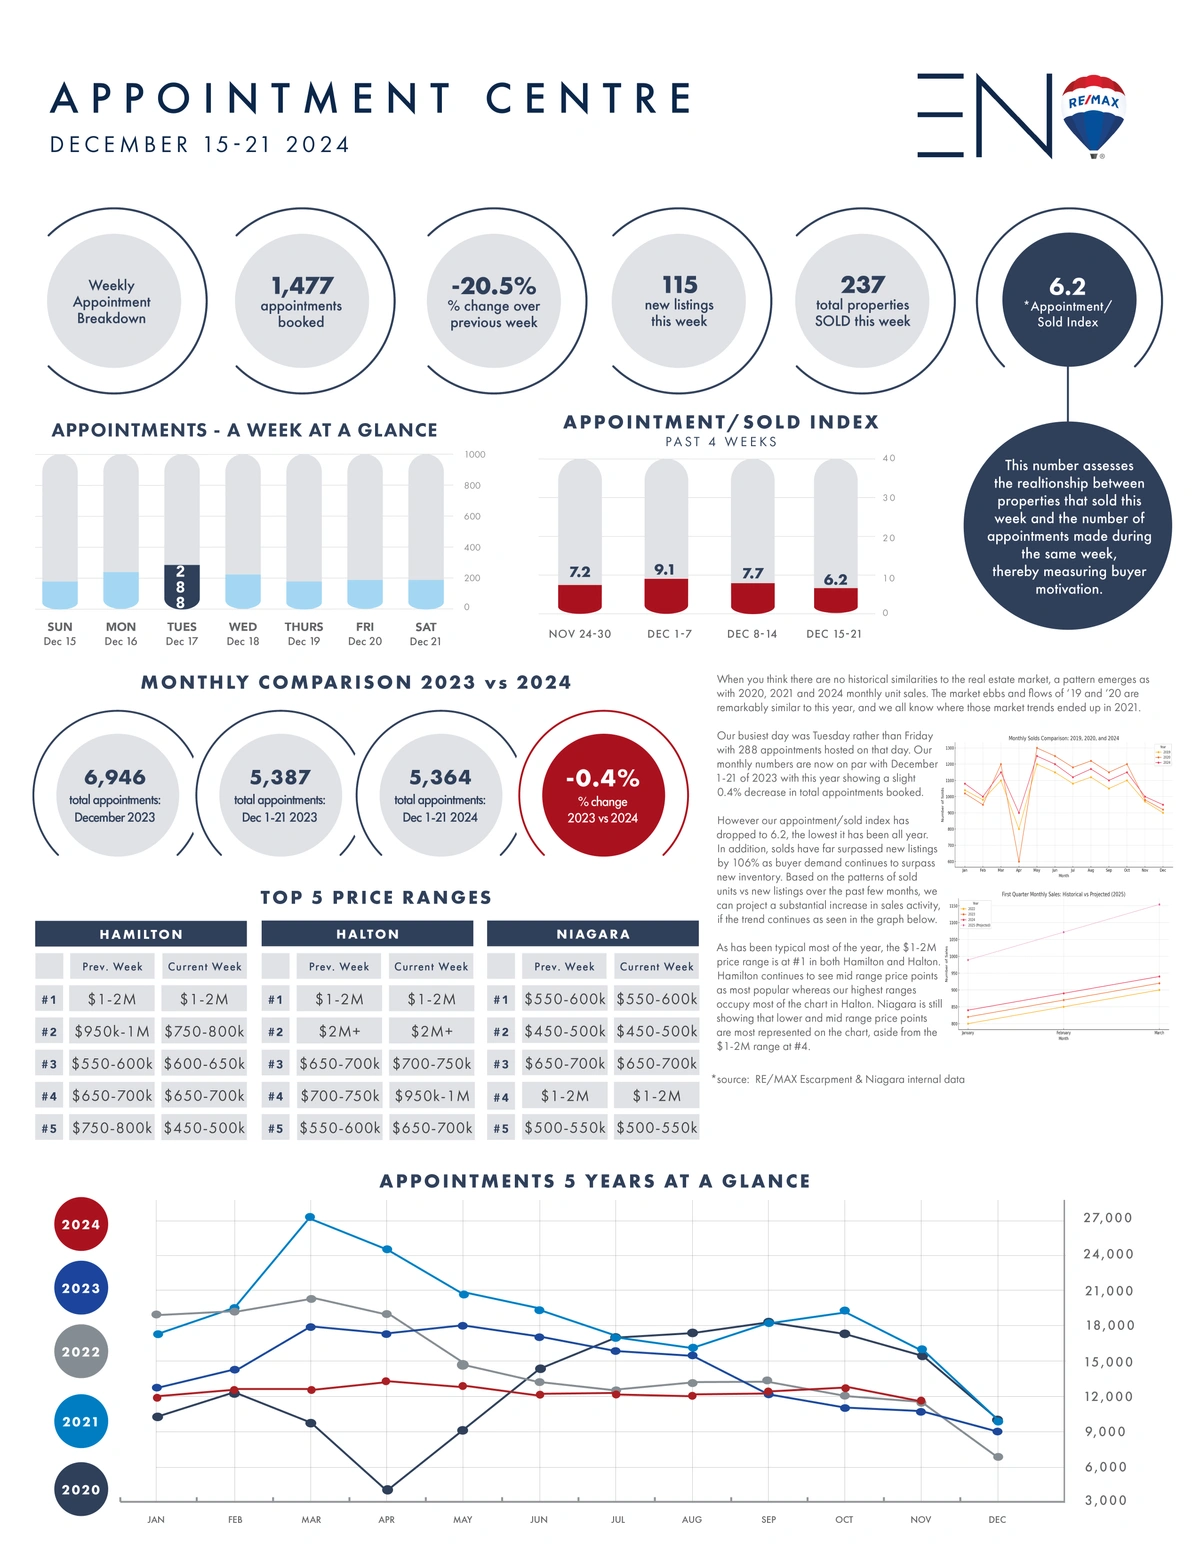
When you think there are no historical similarities to the real estate market, a pattern emerges as with 2020, 2021 and 2024 monthly unit sales. The market ebbs and flows of ‘19 and ‘20 are remarkably similar to this year, and we all know where those market trends ended up in 2021.
Our busiest day was Tuesday rather than Friday with 288 appointments hosted on that day. Our monthly numbers are now on par with December 1-21 of 2023 with this year showing a slight 0.4% decrease in total appointments booked.
However our appointment/sold index has dropped to 6.2, the lowest it has been all year. In addition, solds have far surpassed new listings by 106% as buyer demand continues to surpass new inventory. Based on the patterns of sold units vs new listings over the past few months, we can project a substantial increase in sales activity, if the trend continues as seen in the graph below.
As has been typical most of the year, the $1-2M price range is at #1 in both Hamilton and Halton. Hamilton continues to see mid range price points as most popular whereas our highest ranges occupy most of the chart in Halton. Niagara is still showing that lower and mid range price points are most represented on the chart, aside from the $1-2M range at #4.